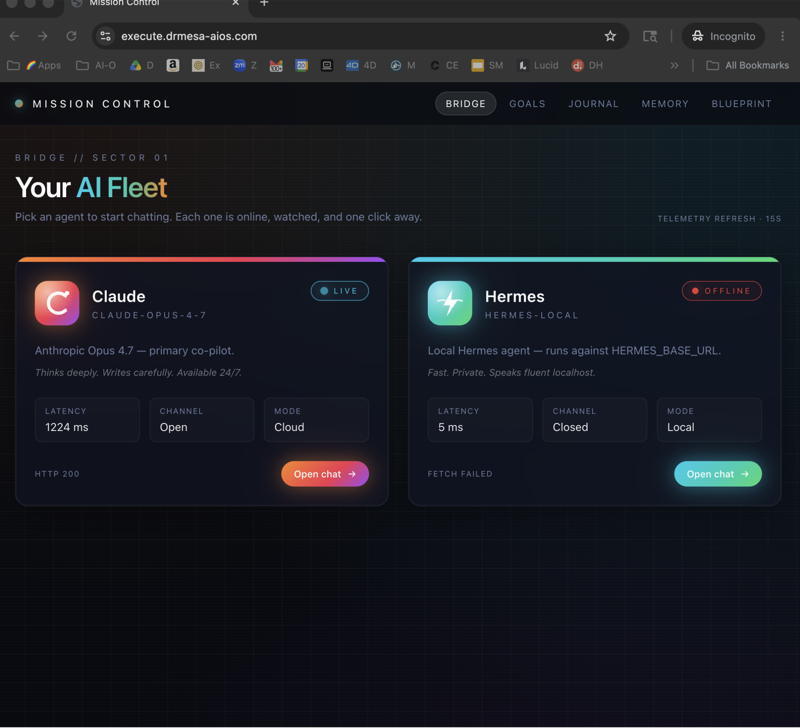
Hermes Agent dashboards are the screens that show you what your Hermes agent is doing, and there are nine worth knowing about.
The one that ships with Hermes opens with a single command, hermes dashboard, and it shows sessions, costs, cron jobs and a kanban board in your browser.
The other eight are Hermes Desktop, the kanban board, Herald OS, Hermes Workspace, Hermes WebUI, Hermes Pixel Office, Hermes3D and my own Agent OS.
This guide is organised by what you want to see, so you can find the right screen in about a minute and open it with the right command.
What Hermes Agent Dashboards Are
Hermes Agent is the free, open-source AI agent from Nous Research, and it began as a terminal tool.
A dashboard is any screen that reads the same Hermes install and shows you its state without typing commands.
The official docs say the front-ends all talk to the same agent and share state, so opening a second dashboard does not create a second agent.
I checked every command in this guide against the help output on my own Hermes install on 14 October 2026, and I checked every third-party project on its own GitHub page the same day.
Which Hermes Agent Dashboard Shows What
Here is the short answer for each thing you might want to see.
| What you want to see | The dashboard I'd open first | Also shows it |
|---|---|---|
| Sessions | The built-in web dashboard, on its Sessions page | Hermes Desktop, Hermes WebUI, Hermes Workspace |
| Costs and tokens | The built-in web dashboard, on its Analytics page | Hermes WebUI, Hermes Workspace, Herald OS |
| Kanban and tasks | The Kanban tab of the built-in web dashboard | Hermes Desktop, Hermes Workspace, Hermes3D |
| Memory | Hermes Desktop, in its Memory Graph | Hermes WebUI, Hermes Workspace, Herald OS |
| Cron jobs | The built-in web dashboard, on its Cron page | Hermes Desktop, Hermes WebUI, Herald OS |
| A multi-agent office | Hermes Pixel Office | Hermes3D, Hermes Workspace |
My own Agent OS shows all six in one place, but it is my own product, so I have kept it out of the first-pick column.
The Nine Hermes Agent Dashboards And How To Open Each
This table is the whole guide in one screen.
| Dashboard | Who makes it | How you open it | Where it appears |
|---|---|---|---|
| Web dashboard | Nous Research, built in | hermes dashboard |
127.0.0.1 on port 9119 |
| Kanban board | Nous Research, bundled plugin | hermes kanban init, then hermes dashboard |
The Kanban tab of the web dashboard |
| Hermes Desktop | Nous Research, official | hermes desktop or the installer |
A native app |
| Herald OS | Luke The Dev, independent | The GitHub releases page | A full-screen app |
| Hermes Workspace | outsourc-e, community | The one-line installer, then pnpm dev |
localhost on port 3000 |
| Hermes WebUI | nesquena, community | Clone, then python3 bootstrap.py |
A local web app on port 8787 |
| Hermes Pixel Office | Teknium | Clone into plugins, then enable it | 127.0.0.1 on port 8113 |
| Hermes3D | LukeTheDev, independent | Clone, npm install, then npm run dev |
localhost on port 3000 |
| My Agent OS | Me | An installable zip inside the AI Profit Boardroom | A local dashboard in the browser |
🔥 Want my exact Hermes Agent Dashboards setup, step by step? Inside the AI Profit Boardroom you get step-by-step video trainings, my installable Agent OS and four coaching calls a week with 3,400+ members building real automations. → Join the AI Profit Boardroom
How To Open The Built-In Hermes Dashboard
The built-in dashboard is where I'd start, because there is nothing to install.
hermes dashboard
That command starts a local web server and opens http://127.0.0.1:9119 in your browser.
The docs say the dashboard runs entirely on your machine and no data leaves localhost.
These are the flags I use most, and all of them are in hermes dashboard --help.
| Flag | What it does |
|---|---|
--port 8080 |
It moves the dashboard to a different port. |
--no-open |
It starts the server without opening a browser tab. |
--status |
It lists the Hermes web servers that are already running. |
--stop |
It stops every running Hermes web server. |
One dashboard manages every profile on the machine, and a profile switcher in the sidebar decides which profile you are editing.
If you bind the dashboard to anything other than 127.0.0.1, it refuses to start until you set up a password or a sign-in, so keep it local and use a tunnel.
If Hermes itself is not installed yet, my one-click Hermes setup guide covers that first.
Where To See Your Sessions
The Sessions page of the built-in dashboard is the most complete view I know.
Each row shows the session title, the source platform, the model, the message count, the tool call count and how long ago it was active.
Tabs for Chats, Automation and All let you hide cron and API noise, and a search box runs a full-text search across every message.
The Status page is the quicker glance, because it lists the 20 most recent sessions and refreshes every five seconds.
Hermes Desktop has its own session list with archiving and search by id, and it shows the same history as the terminal.
Hermes WebUI puts sessions in the left sidebar, and its README says sessions you started in the command line appear there with a "cli" badge.
The terminal route is one command.
hermes sessions list
Where To See Costs And Tokens
The Analytics page of the built-in dashboard is the one I'd trust for spend.
You pick 7, 30 or 90 days, and it shows total tokens, the cache hit percentage, the total cost and a per-model table with estimated cost.
The terminal version is hermes insights, which takes a --days flag.
hermes insights --days 7
Hermes WebUI shows input tokens, output tokens and estimated cost per conversation, and its README says that display is off by default.
Hermes Workspace lists a cost ledger and a model mix on its own Dashboard page.
Herald OS has a Usage view that its README describes as what Hermes used this week and this month, with a warning at 90% of your model plan.
Hermes Desktop shows a live context meter with a token breakdown in its status bar, and I use the Analytics page next to it for the money side.
🔥 Want the exact Hermes dashboards I keep open all day? Inside the AI Profit Boardroom, I walk through the Hermes dashboard, the kanban board and my own Agent OS step by step. You also get four coaching calls a week with 3,400+ members. → Get access here
Where To See The Kanban Board And Tasks
The kanban board is a bundled dashboard plugin, so it lives inside the built-in dashboard.
hermes kanban init
hermes dashboard
The first command creates the board once, and the second gives you a Kanban tab after Skills in the navigation.
The board has one column per status, which are triage, todo, ready, running, blocked and done.
Updates arrive live, so a task an agent finishes in the background moves on your screen without a refresh.
These two commands give you the same view in a terminal.
hermes kanban watch
hermes kanban stats
Hermes Desktop has a Kanban page with a board switcher in its header, and it sends desktop notifications when a task completes or gets blocked.
Hermes Workspace has its own Kanban TaskBoard with backlog, ready, running, review, blocked and done lanes, and I use it as an AI to-do list.
Where To See Memory
Memory is the one area where the built-in dashboard is thin.
Its System page lets you pick an external memory provider and reset the built-in MEMORY.md and USER.md stores, but it is not a memory browser.
Hermes Desktop is where I'd look instead, because its Memory Graph lays out skills and memories as a zoomable map with a timeline.
You open it from the command palette, or you type /journey in a chat.
The same view exists in the terminal.
hermes journey
Hermes WebUI has a Memory panel where you view and edit MEMORY.md and USER.md inline.
Hermes Workspace lets you browse, search and edit agent memory in a markdown editor.
Herald OS has a Memory page of its own, and I spotted my Telegram details sitting in mine, so check it before you share your screen.
Where To See Cron Jobs
The Cron page of the built-in dashboard lists every scheduled job with its prompt, schedule, state, delivery target, last run and next run.
You can create a job, pause it, edit it, trigger it now or delete it from that page.
Hermes Desktop has a Cron pane, and an "All profiles" switch there gathers every profile's jobs into one list.
Hermes WebUI calls its cron view Tasks, and it adds run history and completion alerts.
Herald OS has an Automations page, and my automations synced across Herald OS, Hermes Desktop and my Agent OS with no extra work.
The terminal checks are quick.
hermes cron list
hermes cron status
🚀 Ready to put Hermes Agent Dashboards to work in your business? Inside the AI Profit Boardroom you get step-by-step video trainings, my installable Agent OS and four coaching calls a week with 3,400+ members building real automations. → Join the AI Profit Boardroom
Where To See A Multi-Agent Office
An office view shows each agent as a character, so you can see who is working and who is stuck.
Hermes Pixel Office is the one I have used, and it is a free plugin by Teknium.
git clone https://github.com/teknium1/hermes-pixel-office ~/.hermes/plugins/pixel-office
hermes plugins enable pixel-office
You then start a new Hermes session and open 127.0.0.1 on port 8113.
Every session becomes a pixel character at a desk, and a red exclamation mark appears over any agent that is waiting for your approval.
It is a window and not a controller, so you cannot run agents from it.
Hermes3D is the 3D version of the same idea, and its README calls it a 3D virtual office for AI agents that you run on your own infrastructure.
I have not tested Hermes3D myself, so everything I say about it comes from its README.
It is an unofficial community project that is not affiliated with Nous Research, it has one release from August 2026, and its last push was in late August 2026.
My Hermes3D guide covers the adapter, the demo mode and the limits in full.
How To Open The Other Hermes Agent Dashboards
Hermes Desktop
Hermes Desktop is the official native app, and it uses the same config, keys, sessions, skills and memory as the command line.
hermes desktop
You can also download the installer from the Hermes Desktop page for macOS on Apple Silicon, Windows or Linux.
Herald OS
Herald OS is an independent, MIT-licensed agent OS with Hermes as the interface, and its README marks it as an alpha at version 0.1.
On a Mac you need macOS 13 or later on Apple Silicon, you install Hermes first, and then you download the build from the releases page.
The build is not notarised by Apple yet, so you run this once before you open it.
xattr -dr com.apple.quarantine "/Applications/Herald OS.app"
Its Overview page offers a "Pick up where you left off" card, and my Herald OS setup guide tours every page.
Hermes Workspace
Hermes Workspace is a community command centre, and it needs Node 22 or later.
curl -fsSL https://raw.githubusercontent.com/outsourc-e/hermes-workspace/main/install.sh | bash
hermes gateway run
cd ~/hermes-workspace && pnpm dev
You run the gateway in one terminal and the workspace in another, then open localhost on port 3000.
Its README says hermes dashboard must also be running on port 9119, because that is where its sessions, skills, config and jobs data come from.
Hermes WebUI
Hermes WebUI is a community browser app built with Python and plain JavaScript, so there is no build step.
git clone https://github.com/nesquena/hermes-webui.git hermes-webui
cd hermes-webui
python3 bootstrap.py
The server binds to 127.0.0.1 by default, and you reach it from a phone through an SSH tunnel or Tailscale.
My Own Agent OS (Not On Public GitHub)
I run Hermes inside my own Agent OS every day, and I am biased about it because I built it.
It gives one Hermes thirteen rooms, including chat, voice, sessions, outreach and memory, next to Claude and my other agents.
Its Manage room embeds the full Hermes dashboard, so sessions, models, logs, cron jobs and skills sit one click away.
Bigger jobs go on a kanban board, where a dispatcher starts a Hermes worker for each ticket.
There is no public GitHub repo for it, and access is inside the AI Profit Boardroom as an installable zip.
If you want to know why I rank it first for my own daily use, read my best UI for Hermes Agent ranking.
💡 Want help wiring these dashboards together? The AI Profit Boardroom has Hermes trainings, the installable Agent OS and four live coaching calls every week, so you can get unstuck quickly. Join 3,400+ members building real agents. → Join the AI Profit Boardroom
Common Problems And Quick Fixes
| Problem | What to try |
|---|---|
| The dashboard won't open on another device | Keep it on 127.0.0.1 and use a tunnel, because a public bind needs a password or a sign-in. |
| The Chat tab shows a banner on Windows | Use WSL2 for that tab, because it needs a POSIX terminal, and the other pages still work. |
| The Kanban tab is missing or empty | Run hermes kanban init, then restart hermes dashboard. |
| Hermes Workspace shows "portable mode" | Start hermes dashboard in another terminal and refresh the page. |
| Pixel Office shows nothing | Start a brand new Hermes session, because plugins load when the process starts. |
| Herald OS will not open on a Mac | Run the xattr command above once, then open it from Applications. |
The Honest Limits
The built-in dashboard is an admin panel, and its Chat tab simply embeds the terminal interface.
Herald OS is an alpha, and its Connections page did not sync for me.
Hermes Workspace has the most moving parts, because it needs the gateway and the dashboard running behind it.
Hermes WebUI's feature list does not describe a kanban board, although its contributor notes mention Kanban fixes, so check the repo before you rely on it for tasks.
Hermes3D has had one release and no pushes since late August 2026, so check the repo for activity before you rely on it.
Which Hermes Agent Dashboard Should You Open First?
Open the built-in web dashboard first, because it covers sessions, costs, cron and kanban with one command.
Add Hermes Desktop when you want memory and a proper chat window.
Add Hermes Pixel Office when you have agents running in the background and you want to see who is stuck.
Try Hermes Workspace or Hermes WebUI when your agent lives on a server and you need it on a phone.
Related Reading
- My best UI for Hermes Agent ranking explains which interface I use daily and why.
- My Hermes3D guide covers the 3D office in full.
- The best Hermes Agent UI list is my earlier ranking of the free front-ends.
- Hermes Agent in the background covers the jobs these dashboards watch.
Also On Our Network
- 🌐 How a business, an agency or a creator uses each Hermes dashboard
- 🌐 Every Hermes dashboard compared feature by feature
- 🌐 Where each Hermes dashboard fits inside an Agent OS
- 🌐 What the dashboards show about model cost, with real bench scores
FAQ: Hermes Agent Dashboards
What are Hermes Agent dashboards?
Hermes Agent dashboards are the screens that show what your Hermes agent is doing.
The built-in one opens with hermes dashboard, and the rest are apps and plugins that read the same install.
How do I open the Hermes Agent dashboard?
You run hermes dashboard in your terminal.
It opens 127.0.0.1 on port 9119 in your browser.
Which Hermes Agent dashboard shows costs and tokens?
The Analytics page of the built-in dashboard shows tokens, cache hit rate, cost and a per-model breakdown.
Hermes WebUI, Hermes Workspace and Herald OS each have a usage view of their own.
How do I open the Hermes kanban board?
You run hermes kanban init once, then hermes dashboard, and you click the Kanban tab.
Hermes Desktop has a Kanban page as well.
Are Hermes Agent dashboards free?
The built-in dashboard, the kanban board and Hermes Desktop are free with Hermes.
The community dashboards are free and MIT licensed, and my Agent OS is available inside the AI Profit Boardroom.
📺 Video notes + links to the tools 👉
🎥 Learn how I make these videos 👉
🆓 Get a FREE AI Course + Community + 1,000 AI Agents 👉
About Julian
I'm Julian Goldie, an SEO entrepreneur, author and founder of the AI Profit Boardroom, which has 3,400+ members.
I help business owners scale with AI agents, automation and SEO.
- I've built Goldie Agency into a seven-figure SEO and link building agency.
- I've grown my YouTube channel to 400,000+ subscribers.
- I run my own Agent OS with Hermes, Claude and other agents under one shared memory.
- I wrote "Link Building Mastery".
→ Get my best AI training inside the AI Profit Boardroom
Start with hermes dashboard, add one more screen only when you need it, and you will get far more out of your Hermes Agent dashboards.